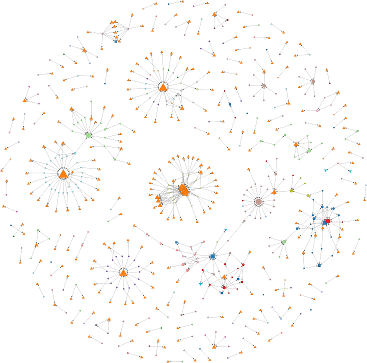
We’ve been doing quite a bit of work improving our Go environment recently, and correcting one or two continuous integration anti patterns we’d introduced. I wanted to find a way to see the effect of these changes, and it occurred to me that it might be possible to use D3.js to build the view. I have had good use cases for graph diagrams in the past but got bored looking for a good way to draw them programatically. I’d even lazily fallen back on the Neo4J console to program the graph and then visualise it (and amusingly I now see that that page is using D3.js behind the scenes).
Anyway, after a quick prototype using Awk to parse the XML configuration file, my interest was tweaked enough to drop that bad habit and embed the parsing in an HTML document using JavaScript. With a bit of tweaking Mike’s D3.js examples allowed me to build what I wanted.
It works by fetching the configuration XML over HTTP, either from the Configuration API (provided you are a logged in Go Admin) or from a URL supplied as a parameter. It then extracts the declared dependencies into JSON and passes this to D3.js to be displayed as SVG. If you want to fetch directly from Go, then you should issue the Access-Control-Allow-Credentials: true header from your Go instance to ensure your browser is allowed to send your cookie credentials to Go.
I also found it interesting to look at previous historical versions of the configuration, which you can get at using the Go configuration API provided you know the MD5 hash. If you don’t, you can use git to query the configuration git repository on the server itself. You can only go back as far as your upgrade to v2.2 though as that is when version control was brought in.
If you’re interested in building one for your own Go instance, take a look at the project website. You can also look at an anonymised example built from our pipeline definitions.


