Our team have often expressed in retrospectives that they feel they should rotate more often. In fact, the irregular rotation is often a theme when trying to get to the root cause of bad design decisions and lacking code architecture. In the spirit of self-organisation we have sought not to impose pair rotation on the team, instead encouraging them to retrospect on this themselves and come up with their own scheme. The only limitation we’ve given is that one of the developers should remain on the story in each swap, so that some context is retained.
Initially rotating every day, the team eventually decided to swap on Tuesdays and Thursdays. It doesn’t happen that often though, and I’d be more comfortable seeing a bit more rotation. Sensing a bit of a smell, and wondering if there might be a pattern I decided to mine the data we had in the Subversion commit messages in an attempt to visualise the situation.
Subversion, like most if not all SCMs allows you to comment each revision of the code that you commit. Often organisations impose a standard pattern for these messages using a commit hook on the Subversion server. Whilst we do not do this, we do follow a conventional structure (at least within each project). Consultants who helped us to introduce pairing suggested that both committers be referenced in the messages. So we’ve ended up with something looking like this:
Project: 123: [mark-c, bob-s] #456 Adding a missing test case to exercise the empty case.
Using this exercise as an opportunity to explore Awk a little further than my usual single like examples, I wrote a script to build a two dimensional array indexed by each of the pair members containing the frequency of commit messages for the given pair.
I then copied this data into Excel, the handy novice statistician’s friend, and build a pivot table from the results with columns representing one committer and rows representing the second committer. Using the conditional formatting in Excel 2010 allowed me to quickly colour the cells according to frequency.
So what am I left with? An easy to read heat map of how often people commit with each other. Granted, it’s not a true representation of how often Mark and Bob work together, as it is skewed by the fact that Mark commits more often when he works with Bob, than when he works with Fred.
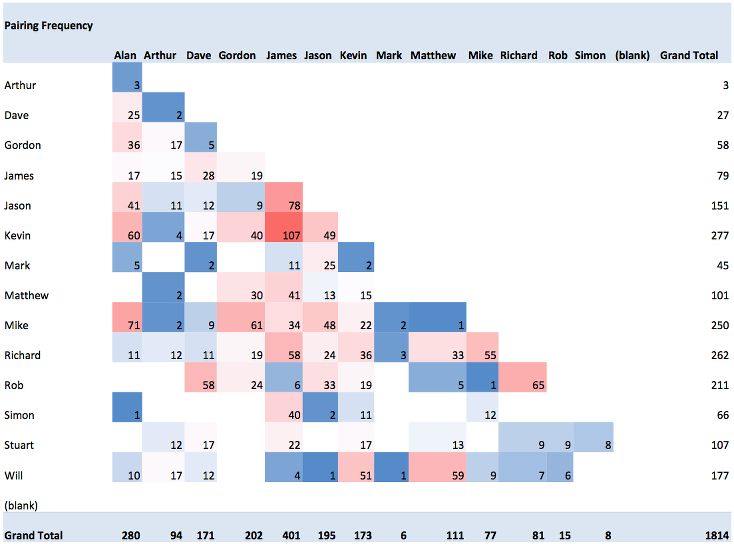
The team were fascinated, as people tend to be with any visualisation. Without drawing too many conclusions I have left the chart visible in the area where developers have their morning standup and organise rotation so we shall see what happens.
I’m not going to speculate too much about why rotation isn’t happening enough - the focus of this article is on working out how often the team swaps. Suffice to say I think there are deeper reasons than just forgetting it’s a Tuesday or being a at a convenient point in development.
###A note about the script:
I chose Awk because I wanted to get better at parsing log files etc and aggregating data - I’m sure there are much more appropriate technologies. I’ve provided the source. It expects the subversion log to be piped into it on standard input. I suggest that unless you are lucky enough that your commit message format exactly matches ours, you export the Subversion log to a text file to facilitate your adaption of the regexp (because ‘svn log’ can be slow).
In a nutshell it finds interesting lines in the log, extracts the usernames, discards any commits for departed developers, translates the username variations to one name (since variety is the spice of life), increments an array value and summarises the results to standard out in a format you can easily paste into Excel. I’m sure there are better visualisation technologies which you could probably script but I was aiming for the quick and dirty (yet reproducible). I’ve also provided the shell of the spreadsheet that I used.
| You should invoke it using ‘svn log | processpairing’ or ‘cat svn.log | processpairing’ if you chose to output the log to a file. |
###Ideas for improvement
- Scriptable visualisation
- Automating it in our pipeline
/^.*\[[a-zA-Z-]+[ ]*,[ ]*[a-zA-Z-]+\].*$/ {
  # split the pair names into array of names
  split($2,names,"[, ]+");
  # check whether we are interested in this pair
  if (match(names[1],namesToIgnore) == false && match(names[2],namesToIgnore) == false) {
    # compensate for variety in the names people specify in commit messages
    if(names[1] in substitute) {
      name1=substitute[names[1]]
    }
    else {
      name1=names[1]
    }
    if(names[2] in substitute) {
      name2=substitute[names[2]]
    }
    else {
      name2=names[2]
    }
    if (name1 < name2) {
      pairfreq[name1,name2] += 1;
    }
    else {
      pairfreq[name2,name1] += 1;
    }
  }
}
END {
  numberOfPairings = asorti(pairfreq,pairs)
  for (pairNumber; pairNumber <= numberOfPairings; pairNumber++) {
    split(pairs[pairNumber],pairnames,",");
    print "\""pairnames[1]"\",\""pairnames[2]"\",\""pairfreq[pairs[pairNumber]]"\"";
  }
}