Update: I’ve rewritten this with more features and better code—take a look!
I spend literally hours a week just trawling logs, often wanting to visualise what I’m seeing. Yes, I could faff with Splunk or something else expensive (yes, I know there is a free version), but sometimes I just want to know what a column of response times looks like.
Previously I was quite a fan of using uniq -c for this aggregation, like this:
[something outputting lines with one number or some text] | sort | uniq -c | awk '{print $2 " " $1}' | sort -n
Which for the UNIX dictionary does this (first two parts just output lines with the length of one word):
mark$ cat /usr/share/dict/words | awk '{print length($1)}' | sort | uniq -c | awk '{print $2 " " $1}' | sort -n
1 52
2 160
3 1420
4 5272
5 10230
6 17706
7 23869
8 29989
9 32403
10 30878
11 26013
12 20462
13 14939
14 9765
15 5925
16 3377
17 1813
18 842
19 428
20 198
21 82
22 41
23 17
24 5
… which you’ll all appreciate is a pivot table of word lengths in the handy list of words provided with most UNIX systems. First column is the word length, second is the frequency.
Takes a bit of reading doesn’t it?
Better than that would be something graphical. Using my handy distribution script does this:
mark$ cat /usr/share/dict/words | awk '{print length($1)}' | distribution -v max_width=30
Value Height %ile Histogram
0 0 0.0000
1 52 0.0220 #
2 160 0.0899 #
3 1420 0.6919 ##
4 5272 2.9268 #####
5 10230 7.2637 ##########
6 17706 14.7698 #################
7 23869 24.8887 #######################
8 29989 37.6021 ############################
9 32403 51.3388 ##############################
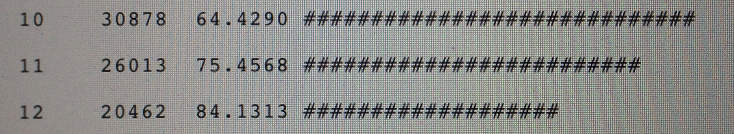
10 30878 64.4290 #############################
11 26013 75.4568 #########################
12 20462 84.1313 ###################
13 14939 90.4645 ##############
14 9765 94.6042 ##########
15 5925 97.1160 ######
16 3377 98.5476 ####
17 1813 99.3162 ##
18 842 99.6731 #
19 428 99.8546 #
20 198 99.9385 #
21 82 99.9733 #
22 41 99.9907 #
23 17 99.9979 #
24 5 100.0000 #
That’s pretty right? You remember the normal distribution don’t you?
It’s even nice enough to work out that you only had 24 records, and so curtailed its default of a chart with a height of 55 rows. If you supply more than 55 records it will work out the value of each bar to distribute your records over 55 lines. If you want to reduce the number of lines, or supply a higher maximum you can pass in a max_lines variable. You can also supply a max value to zoom in on the beginning of the chart.
mark$ cat /usr/share/dict/words | awk '{print length($1)}' | distribution -v max_lines=5 -v max=10 -v max_width=30
   Value   Height     %ile Histogram
       0       52   0.0429 #
       2     1580   1.3476 #
       4    15502  14.1485 ########
       6    41575  48.4794 ####################
       8    62392 100.0000 ##############################
      10        0 100.0000
I haven’t implemented a min value because thinking about that makes my head hurt. If you fancy doing it yourself, let me know so I can use it :)
Issues: Percentiles are wrong (for some interpretations of wrong) when you zoom in or change the max rows.
Get the script: http://bit.ly/log-ninja
Oh, and see Zach Holman’s Spark tool for another smart command line visualisation of numbers.
Perhaps (following Zach Holman’s example) you want to understand the distribution of earthquake magnitudes in the last week? Simple.
mark$ curl http://earthquake.usgs.gov/earthquakes/catalogs/eqs7day-M0.txt  --silent | sed '1d' | cut -d, -f9 | distribution -v max_width=30
   Value   Height     %ile Histogram
       0      274  23.7435 ################
       1      545  70.9705 ##############################
       2      196  87.9549 ###########
       3       45  91.8544 ###
       4       59  96.9671 ####
       5       31  99.6534 ##
       6        4 100.0000 #
Reassuring eh? Just feel lucky you weren’t in one of those 94 +4MMS events!
Awk, I <3 you.